The starting point
Spreadsheets show numbers, not the flow of sales. Nobody saw where each deal stood, what profit it would bring or which deals had stalled.
What I built
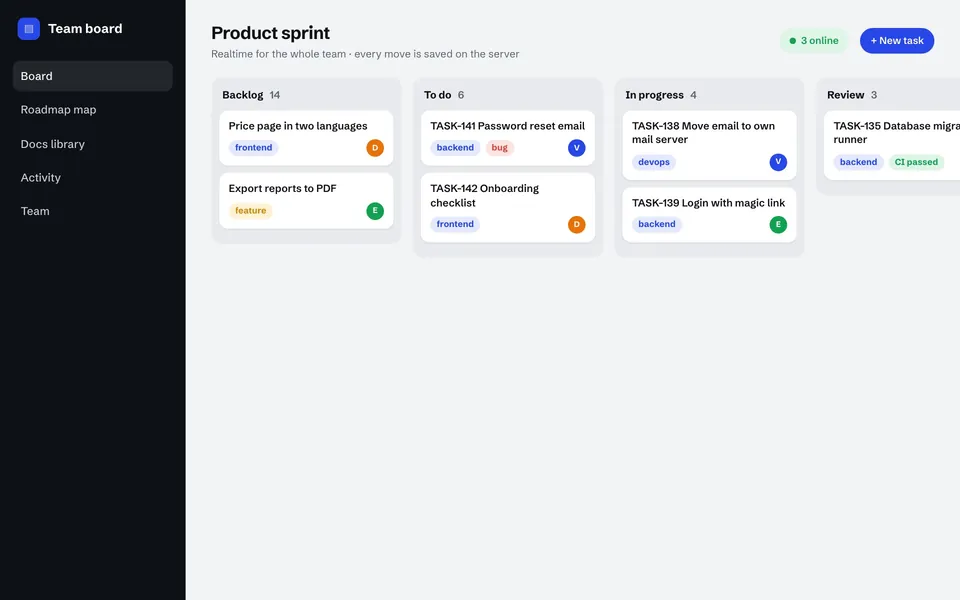
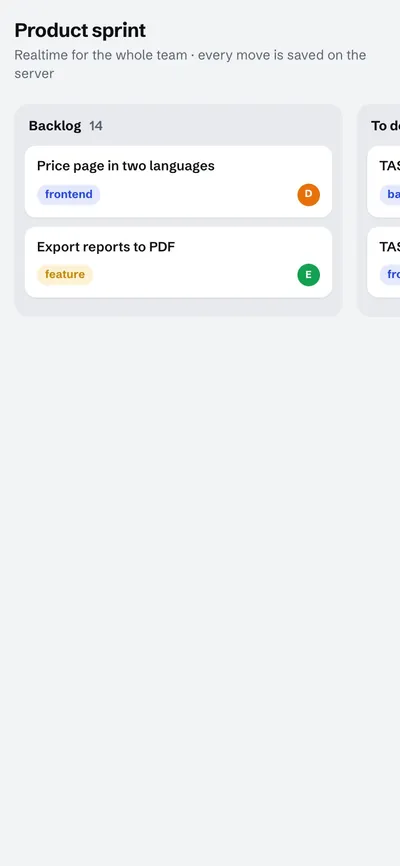
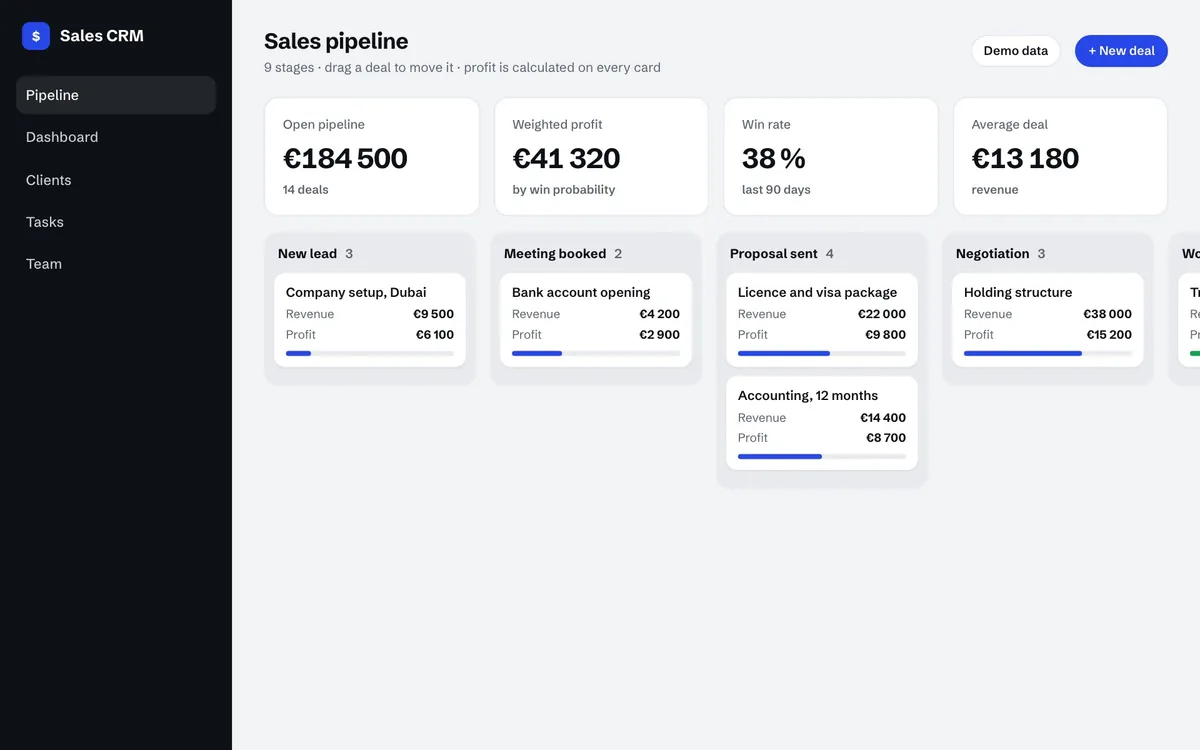
- A nine stage pipeline. From new lead to won or lost, with drag and drop between columns.
- Profit on every card. Revenue and cost give profit automatically, and win probability gives the weighted value.
- Status that sets itself. Moving a card to won or lost updates its status automatically.
- Everything about the deal. Checklists, comments, attachments up to 15 MB and filters.
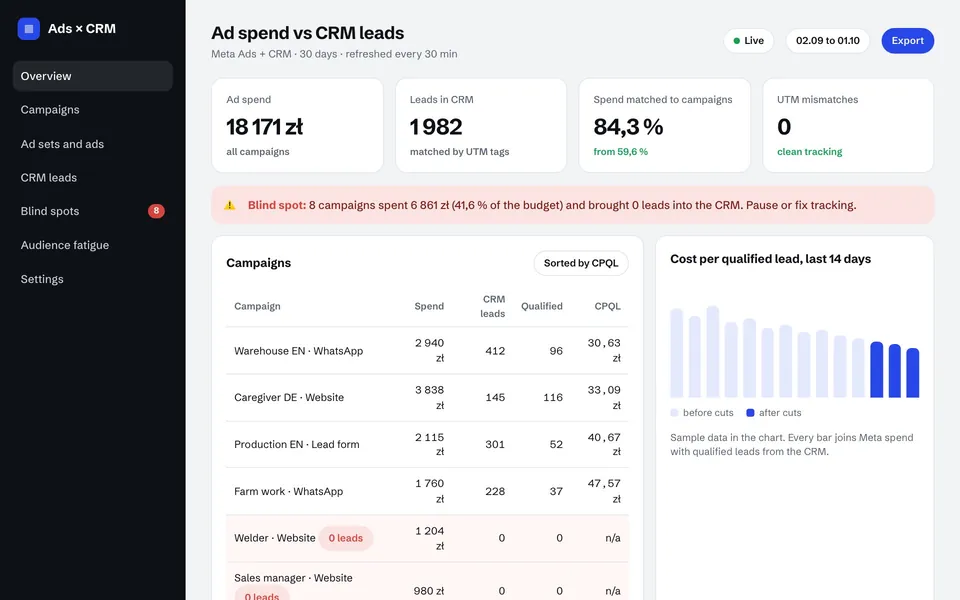
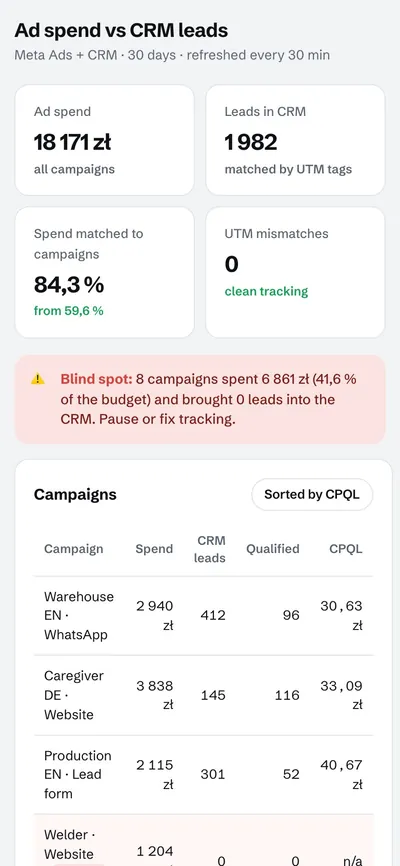
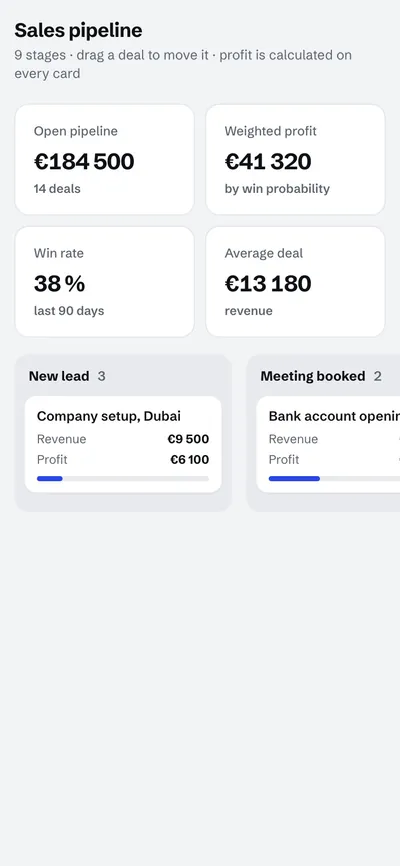
- A dashboard. Open pipeline, weighted profit, win rate and average deal size.
- Several users. Its own login and realtime updates between users.
The result
The consultancy got a prototype with 20 API routes, 11 data models and four pages that could be tested with real deals the same day. It has not been put into production. Next steps are import from the spreadsheet, email from the card and a link to invoicing.
Tools and tech stack
- Next.js
- Prisma
- SQLite
- dnd-kit
- Tailwind CSS
The client is anonymised. The numbers come from the project's own reports and measurements.